

There are more Mageia tools than those that can be started in the Mageia Control Center. Click on a link below to learn more, or continue reading the next pages.
“Mageia Bug Report Tool”drakbug
“Collect Logs and System Information for Bug Reports”drakbug_report
“Display Available NFS And SMB Shares”TO BE WRITTEN
And more tools?
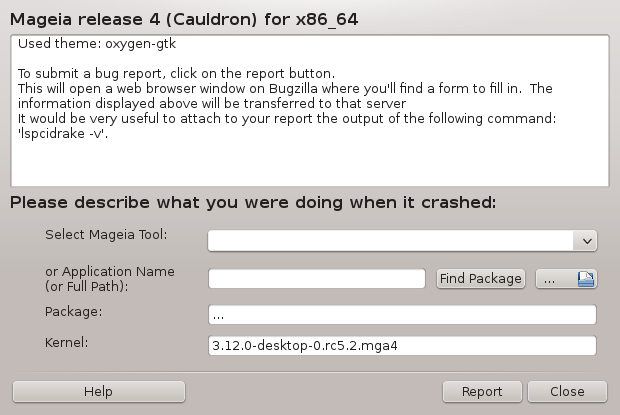
En general, aquesta eina[50] s'inicia automàticament quan una eina a Mageia falla. No obstant això, també és possible que, després de presentar un informe d'error, se li demanarà per iniciar aquesta eina per comprovar algunes de les informacions que dona i, a continuació, establir l'informe d'error existent.
Si un nou informe d'error ha de ser presentat i no esteu acostumat a fer això, aleshores si us plau, llegiu Com informar d'un error correctament abans de fer clic al botó "Informar".
En cas que l'error ja s'hagi presentat per algú altre (aleshores, el missatge d'error que va donar drakbug serà el mateix), és útil per afegir un comentari a aquest informe existent on també vàreu veure l'error.
Aquesta eina[51] només pot ser iniciada i utilitzada a la línia d'ordres.
Es recomana escriure la sortida d'aquesta ordre a un arxiu, per exemple fent drakbug_report > drakbugreport.txt, però segur de tindre prou espai al disc en primer lloc: l'arxiu fàcilment pot ocupar diversos GB de grandària.
Nota
La sortida és massa gran per adjuntar un informe d'error sense suprimir-ne primer les parts que no siguin necessàries.
Amb aquesta ordre es recopila la següent informació del vostre sistema:
lspci
pci_devices
dmidecode
fdisk
scsi
/sys/bus/scsi/devices
lsmod
cmdline
pcmcia: stab
usb
particions
cpuinfo
syslog
Xorg.log
monitor_full_edid
stage1.log
ddebug.log
install.log
fstab
modprobe.conf
lilo.conf
grub: menu.lst
grub: install.sh
grub: device.map
xorg.conf
urpmi.cfg
modprobe.preload
sysconfig/i18n
/proc/iomem
/proc/ioport
versió de mageia
rpm -qa
df
Nota
Quan es va escriure aquesta pàgina d'ajuda, la part de la sortida del "syslog" estava buida, ja que aquesta eina encara no s'havia ajustat al nostre canvi al systemd. Si encara està buida, podeu recuperar el "syslog" fent (com a root) journalctl -a > journalctl.txt. Si no teniu una gran quantitat d'espai en disc, per exemple podeu agafar les últimes 5.000 línies del registre amb: journalctl -a | tail -n5000 > journalctl5000.txt.
This tool [52] can only be started and used on the command line.
This page hasn't been written yet for lack of resources. If you think you can write this help, please contact the Documentation team. Thanking you in advance.
This tool [53] can only be started and used on the command line. It will give some more information if used under root.
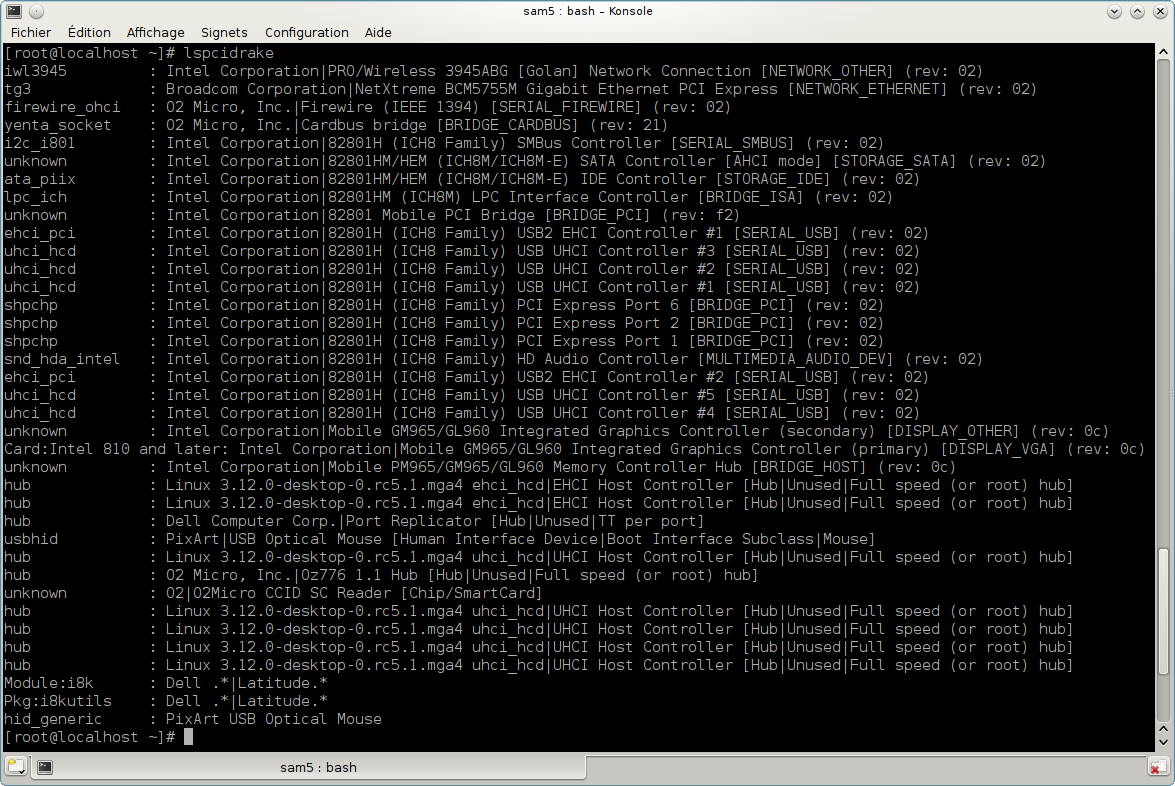
lspcidrake gives the list of all the connected devices to the computer (USB, PCI and PCMCIA) and the used drivers. It needs the ldetect and ldetect-lst packages to work.
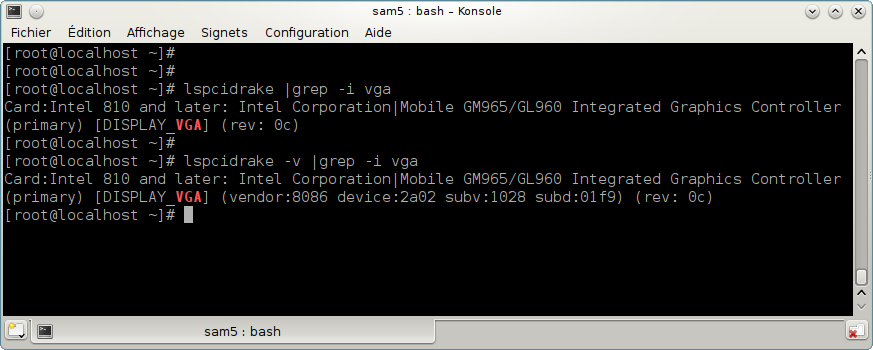
With the -v option, lspcidrake adds the vendor and device identifications.
lspcidrake often generates very long lists, so, to find an information, it is often used in a pipeline with the grep command, like in these examples:
Information about the graphic card;
lspcidrake | grep VGA
Information about the network
lspcidrake | grep -i network
-i to ignore case distinctions.
In this screenshot below, you can see the action of the -v option for lspcidrake and the -i option for grep.
There is another tool that gives information about the hardware, it is called dmidecode (under root)
[50] Podeu iniciar aquesta eina des de la línia d'ordres, escrivint drakbug.
[51] Podeu iniciar aquesta eina des de la línia d'ordres, escrivint drakbug_report com a root.
[52] You can start this tool from the command line, by typing lsnetdrake.
[53] You can start this tool from the command line, by typing lspcidrake.
