

Ka më shumë mjete Mageia se ato që mund të fillojnë në Qendrën e Kontrollit Mageia. Klikoni mbi një lidhje më poshtë për të mësuar më shumë, ose të vazhdo leximin faqeve të ardhshme.
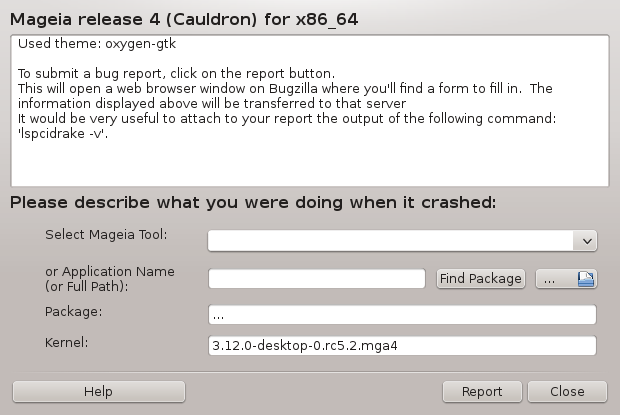
Usually, this tool[50] starts automatically when a Mageia tool crashes. However, it is also possible that, after filing a bug report, you are asked to start this tool to check some of the information it gives, and then provide that in that existing bug report.
If a new bug report needs to be filed and you are not used to doing that, then please read How to report a bug report properly before clicking on the "Report" button.
In case the bug has already been filed by someone else (the error message that drakbug gave will be the same, then), it is useful to add a comment to that existing report that you saw the bug, too.
This tool[51] can only be started and used on the command line.
It is advised to write the output of this command to a file, for instance by doing drakbug_report > drakbugreport.txt, but make sure you have enough disk space first: the file can easily be several GBs large.
Shënim
The output is far too large to attach to a bug report without first removing the unneeded parts.
This command collects the following information on your system:
lspci
pci_devices
dmidecode
fdisk
scsi
/sys/bus/scsi/devices
lsmod
cmdline
pcmcia: stab
usb
Ndarjet
cpuinfo
syslog
Xorg.log
monitor_full_edid
stage1.log
ddebug.log
install.log
fstab
modprobe.conf
lilo.conf
grub: menu.lst
grub: install.sh
grub: device.map
xorg.conf
urpmi.cfg
modprobe.preload
sysconfig/i18n
/proc/iomem
/proc/ioport
version mageia
rpm -qa
df
Shënim
At the time this help page was written, the "syslog" part of this command's output was empty, because this tool had not yet been adjusted to our switch to systemd. If it is still empty, you can retrieve the "syslog" by doing (as root) journalctl -a > journalctl.txt. If you don't have a lot of diskspace, you can, for instance, take the last 5000 lines of the log instead with: journalctl -a | tail -n5000 > journalctl5000.txt.
This tool [52] can only be started and used on the command line.
This page hasn't been written yet for lack of resources. If you think you can write this help, please contact the Documentation team. Thanking you in advance.
This tool [53] can only be started and used on the command line. It will give some more information if used under root.
lspcidrake gives the list of all the connected devices to the computer (USB, PCI and PCMCIA) and the used drivers. It needs the ldetect and ldetect-lst packages to work.
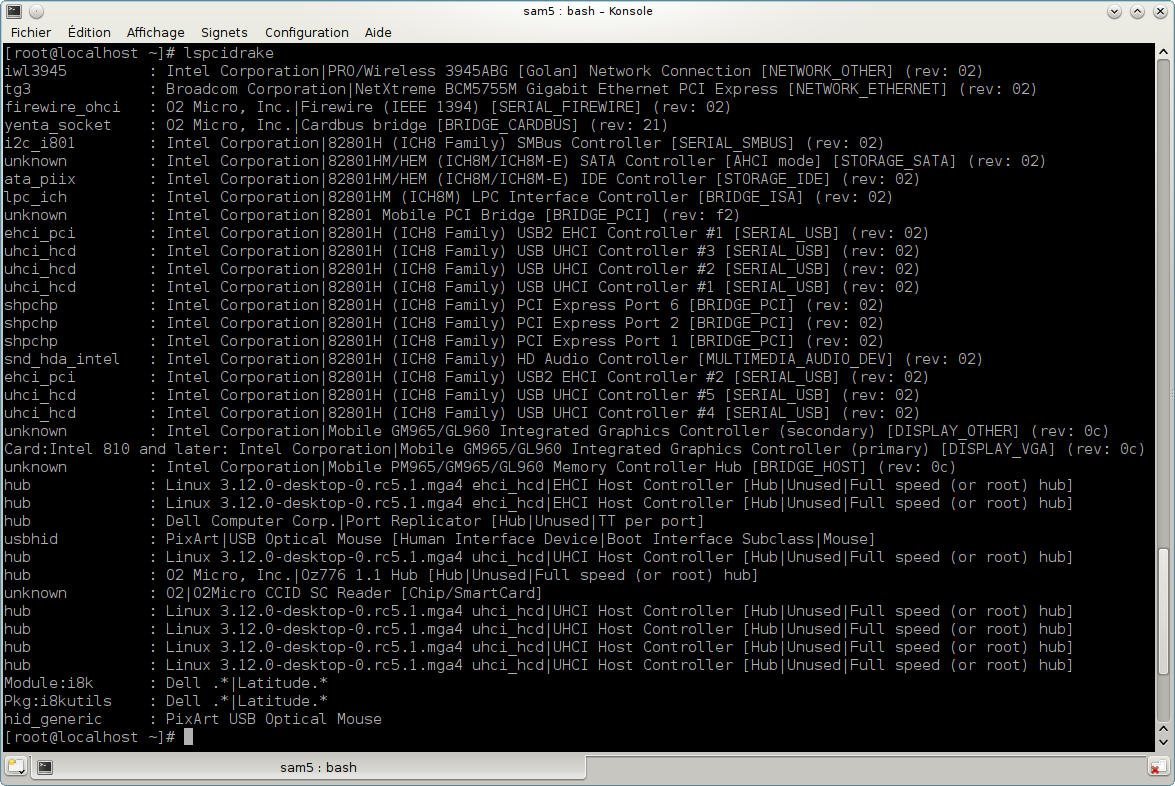
With the -v option, lspcidrake adds the vendor and device identifications.
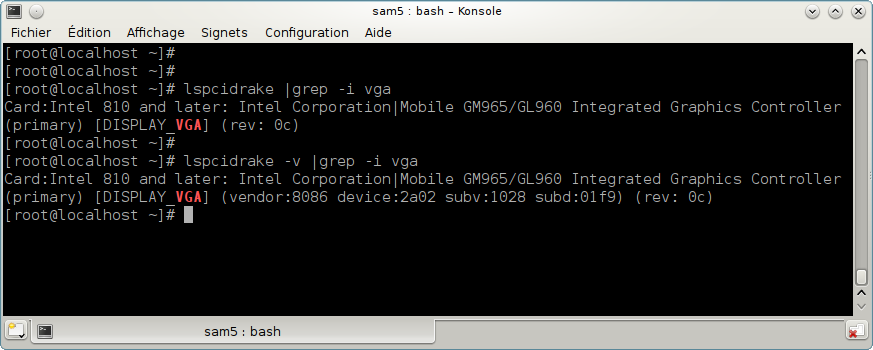
lspcidrake often generates very long lists, so, to find an information, it is often used in a pipeline with the grep command, like in these examples:
Information about the graphic card;
lspcidrake | grep VGA
Informacion në lidhje me rrjetin
lspcidrake | grep -i network
-i to ignore case distinctions.
In this screenshot below, you can see the action of the -v option for lspcidrake and the -i option for grep.
There is another tool that gives information about the hardware, it is called dmidecode (under root)
[50] You can start this tool from the command line, by typing drakbug.
[51] You can start this tool from the command line, by typing drakbug_report as root.
[52] You can start this tool from the command line, by typing lsnetdrake.
[53] You can start this tool from the command line, by typing lspcidrake.
