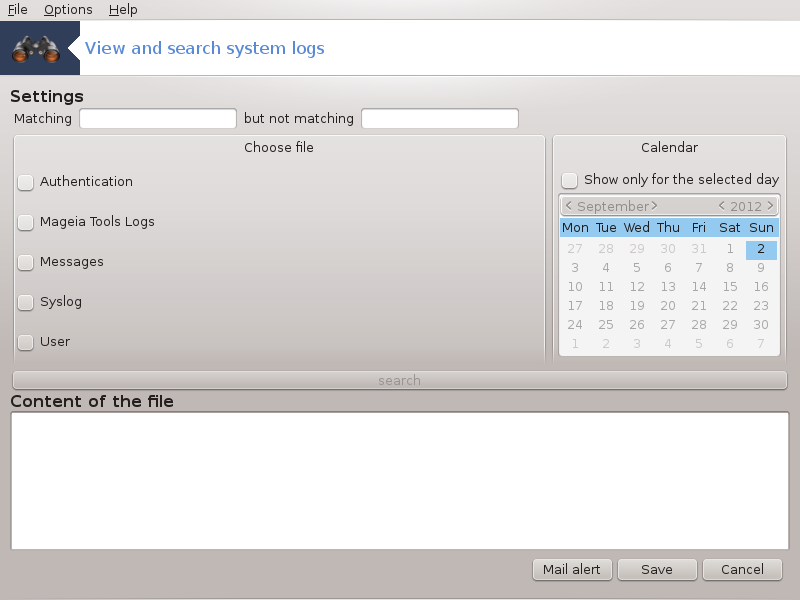
This tool is found in the Mageia Control Center System tab, labelled "View and search system logs".
First, enter the key string you want to look for in the Matching field and/or the key string you want to do not wish to see amongst the answers in the field but not matching. Then select the file(s) to search in the Choose file field. Optionally, it is possible to limit the search to only one day. Select it in the Calendar, using the little arrows on each side of the month and year, and check "". At last, click on the button to see the results in the window called Content of the file. It is possible to save the results in the .txt format by clicking on the Save button.
Note
The houses the logs from the Mageia configuration tools such as the Mageia Control Center tools. These logs are updated each time a configuration is modified.
automatically checks the system load and the services every hour and if necessary sends an e-mail to the configured address.
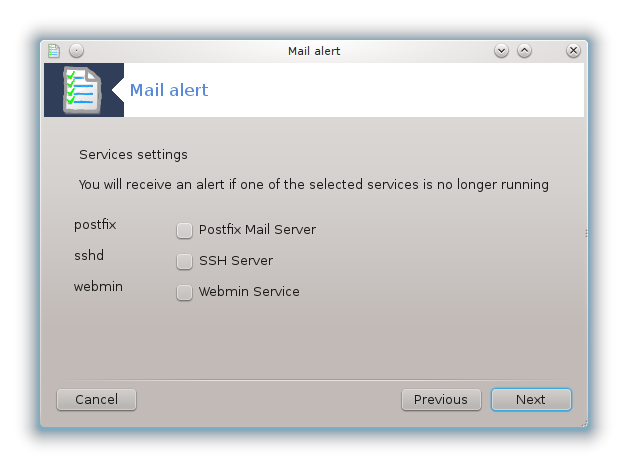
To configure this tool, click on the Mail Alert button and then, in the next screen, on the drop down button. Here, all the running services are displayed and you can choose which ones you want to look watch. (See screenshot above).
The following services can be watched :
Webmin Service
Postfix Mail Server
FTP Server
Apache World Wide Web Server
SSH Server
Samba Server
Xinetd Service
BIND Domain Name Resolve

In the next screen, select the Load value you consider unacceptable. The load represents the demand to a process, a high load slows the system down and a very high load may indicate that a process has gone out of control. The default value is 3. We recommend setting the load value to 3 times the number of processors.
In the last screen, enter the Email address of the person to be warned and the Email server to use (local or on the Internet).


